All capabilities
11 / 14Know the box
Operating the server should not feel like guesswork.
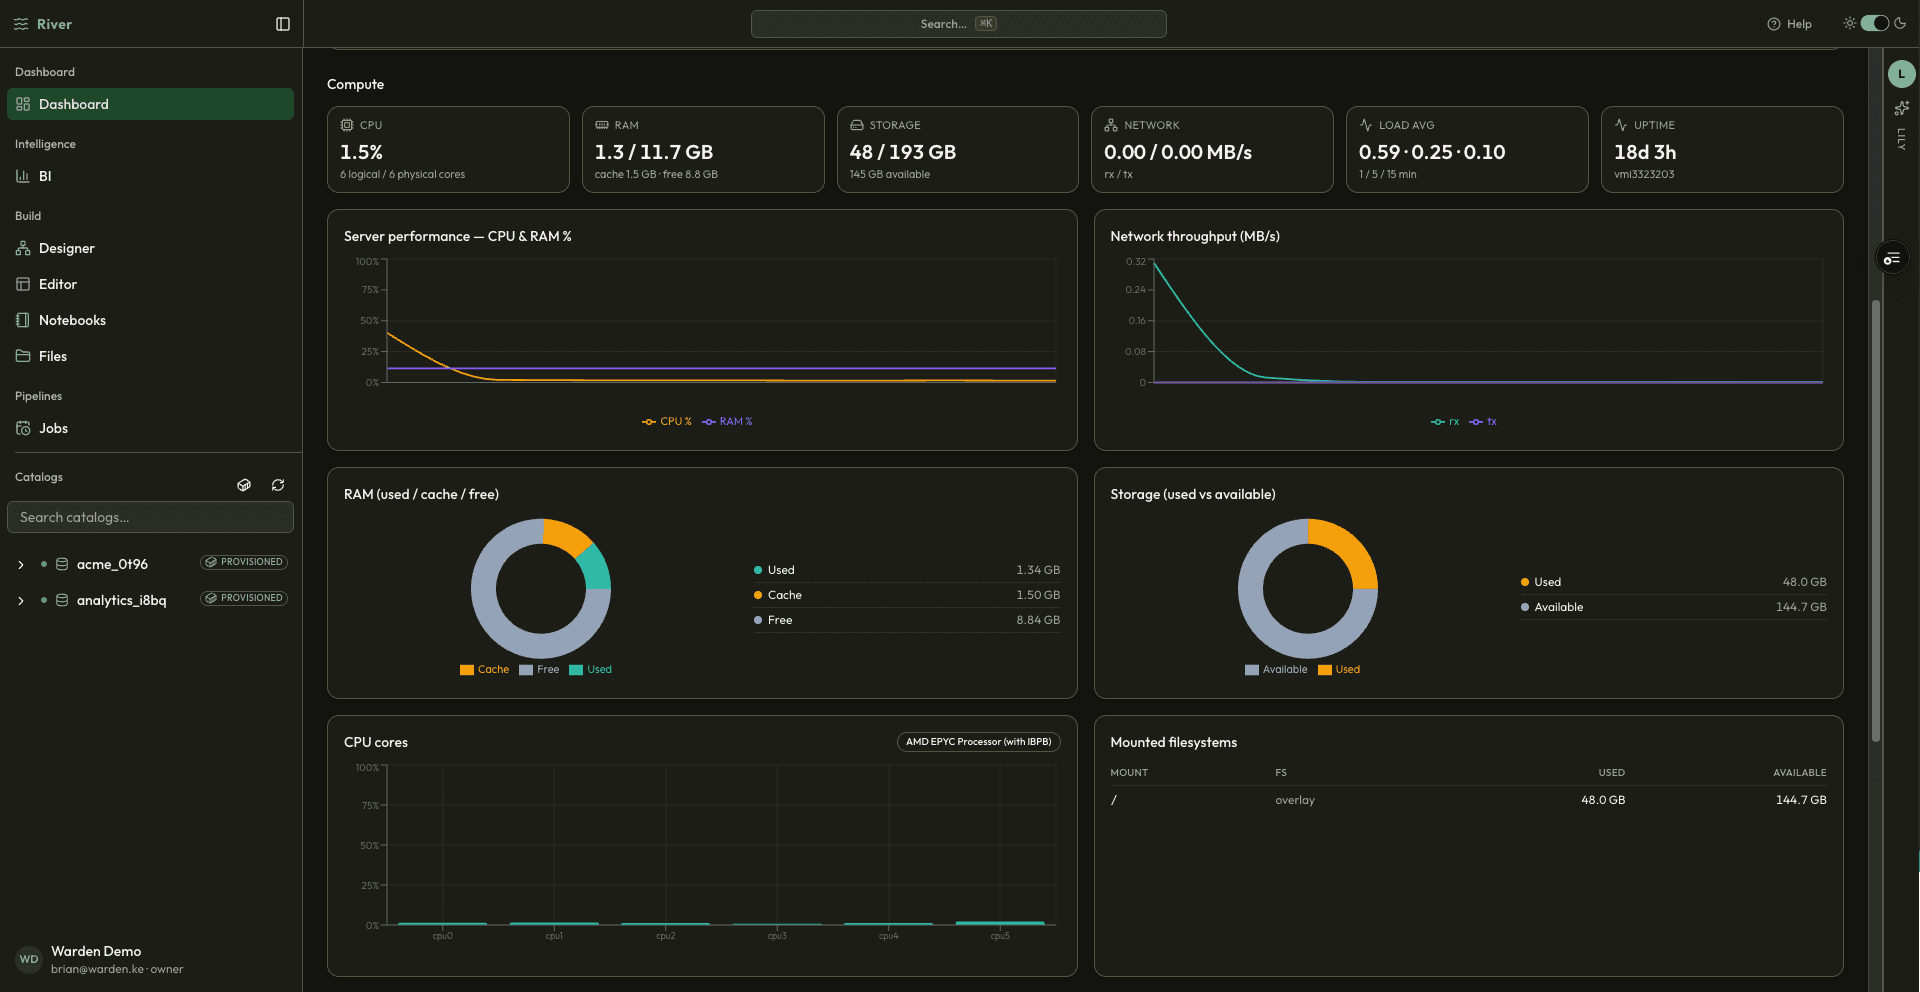
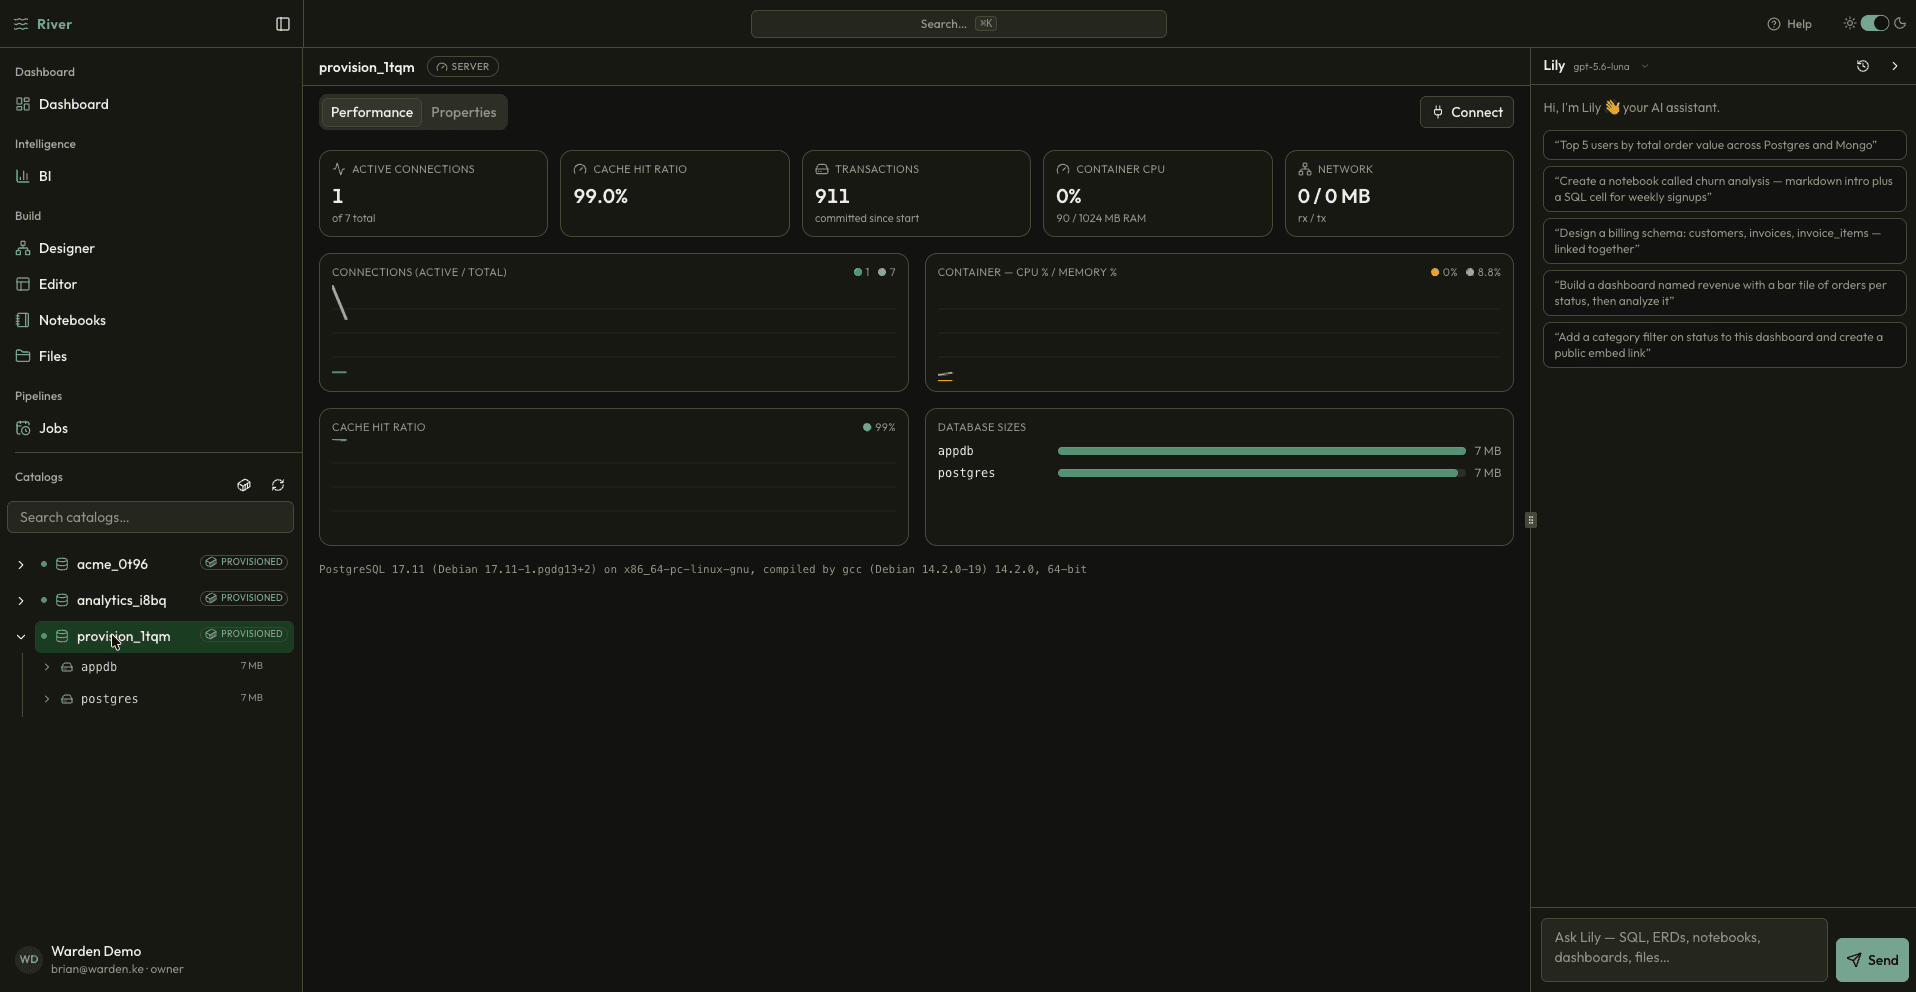
River reports host CPU, memory, storage, and network alongside database performance and query history. Capacity and cost stay visible because the hardware is yours.
Observability
Host CPU / RAM / storage / networkCapacity runwayQuery historyStructured logsPer-query timings
The problem
Self-hosting fails quietly when nobody can see what the machine is doing — until something important is already slow or full.
The River approach
River surfaces host and database metrics in the same place as query history, with structured logs behind every execution.
See it working
Inside Compute & Observability.
river.local / compute
river.local / server
What changes for your team
Less friction between the question and the answer.
See capacity before it becomes an incident
Attribute slow queries to the backend that ran them
Keep the whole box visible without a separate monitoring stack
01
Watch
Track CPU, RAM, storage, and network live.
02
Trace
Follow any query through its sub-queries and timings.
03
Plan
Use capacity runway to size the next step.
Next capability