All capabilities
07 / 14Decisions, not screenshots
Keep the metric and the question in the same place.
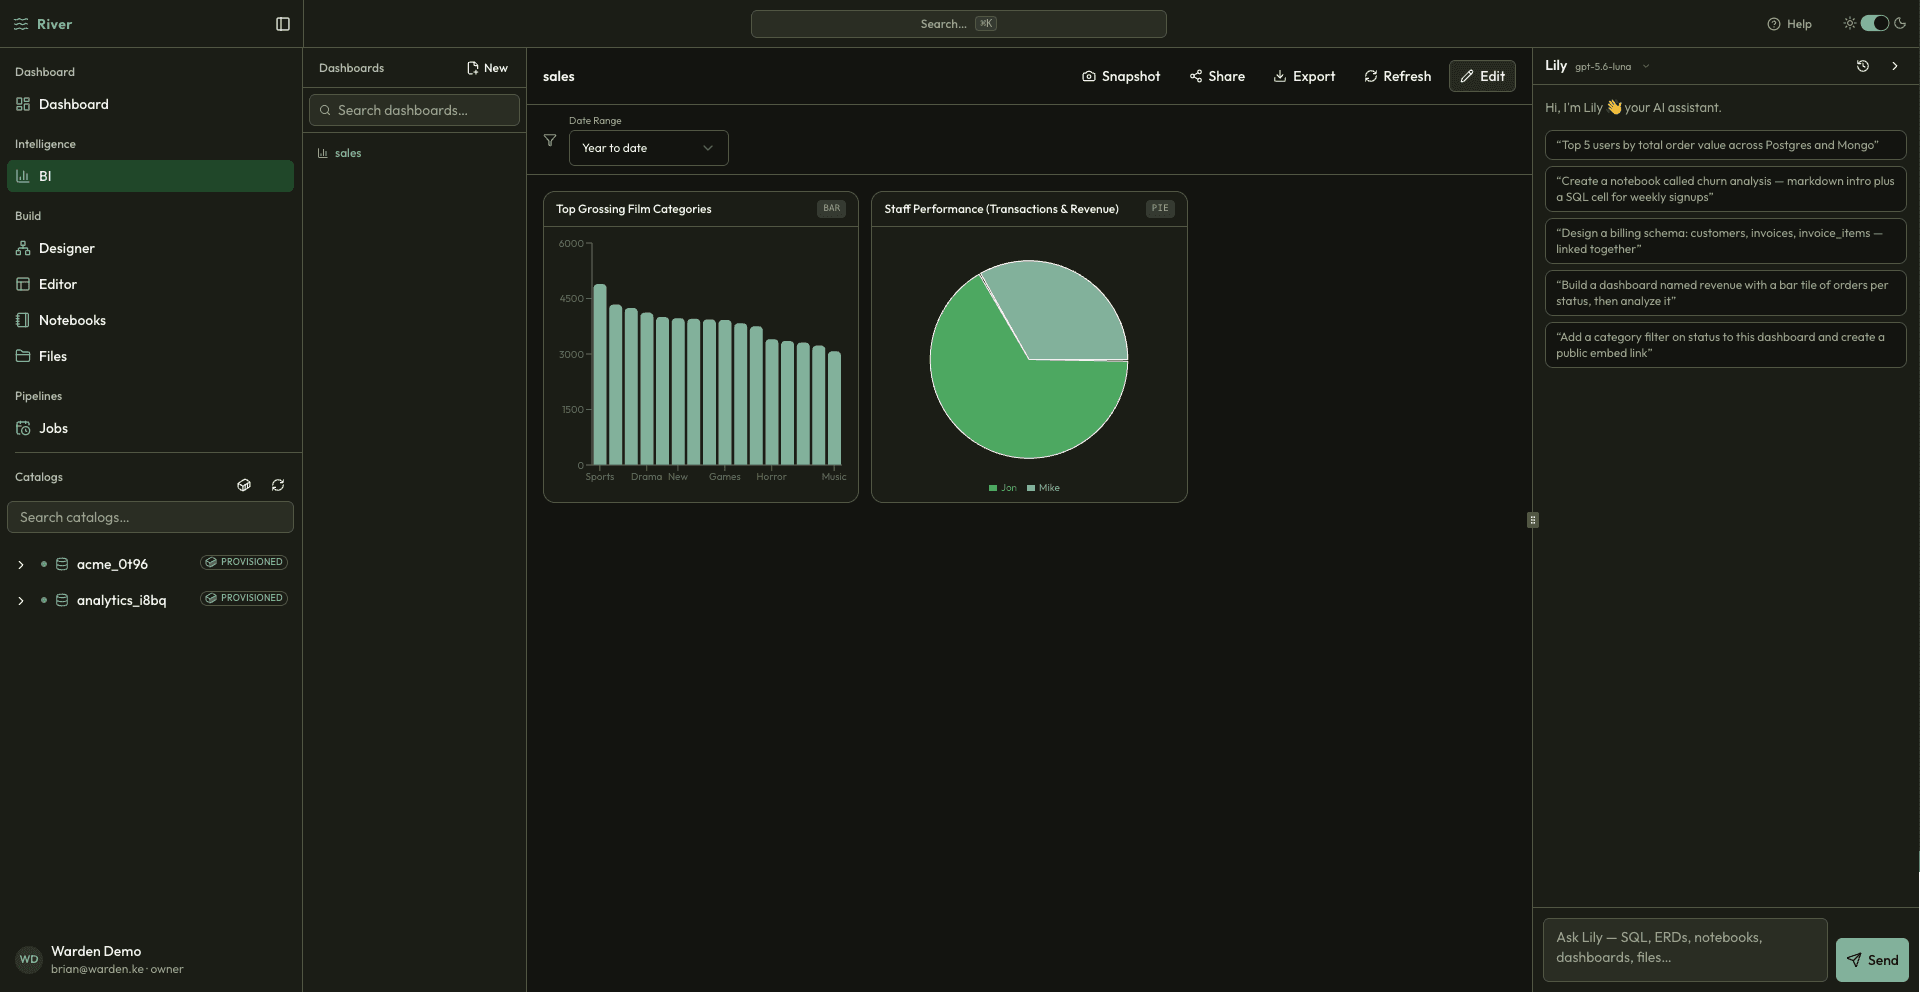
Build focused dashboards from River queries, charts, and live metrics. Give every team a current view of the business without exporting data to yet another tool.
Visualization
KPIBarLinePieScatterHeatmapFilters & parametersPublic embeds
The problem
Reporting gets fragmented across spreadsheets, BI licenses, and screenshots. Definitions drift, refreshes fail silently, and every stakeholder sees a different number.
The River approach
River connects dashboards directly to the queries and sources behind them, so the context, logic, and latest result stay together.
See it working
Inside Business Intelligence.
river.local / bi
What changes for your team
Less friction between the question and the answer.
Give teams one shared source of truth
Move from ad hoc exports to live reporting
Trace a chart back to the query that powers it
01
Explore
Start with a query and shape the result into a useful view.
02
Compose
Arrange charts and metrics for the people who need them.
03
Align
Share one current dashboard with clear definitions.
Next capability